
More than 80% of Americans believe that learning to read and
write must be the number one priority of K-12 students.
Nevertheless, it is surprising that respondents ranked college
education as a low priority. This is despite the low unemployment
rates of college graduates, one of the trends in higher
education[1].
And many would argue that it is the only solution to the
country, even to the world’s problems. But while the number of
students in the US is increasing, the number of schools catering to
them is decreasing. Specifically, this is true of the number of
combined and secondary schools in the school year 2016–17.
That may be alarming, but there is a bright side. Below are
American school statistics that give an idea of the current state
of American education.
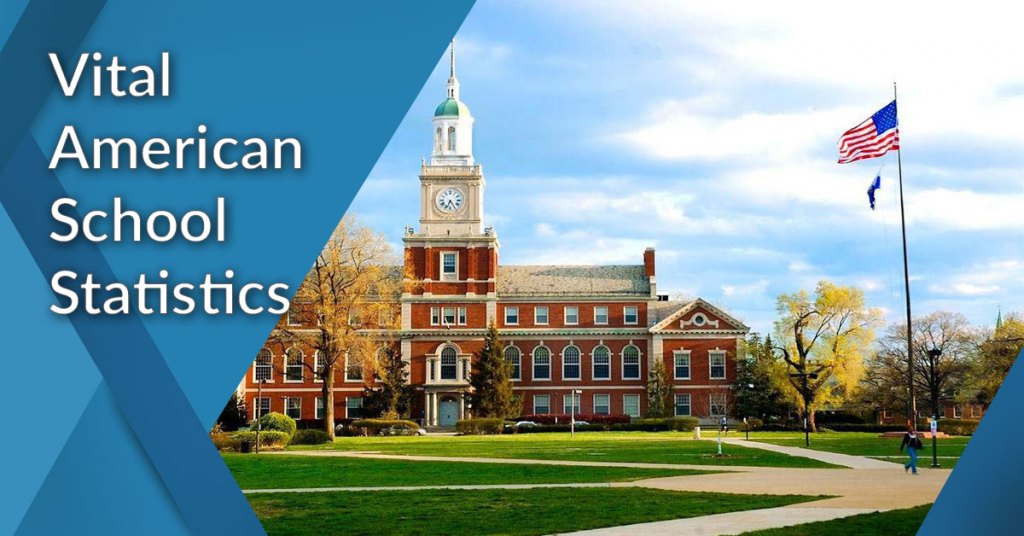
1. Total Number of Schools in the US
The National Center for Education Statistics counted 132,853
elementary and secondary schools in the US[9]
for 2015–16. Afterward, the agency noted a decline in the number of
public schools. To be more specific, secondary and combined schools
decreased. It is to be noted, however, that the number of
elementary schools went up during this period. Here are some facts
about American schools to start with.
- Among those, 88,665 are elementary schools, and 26,986 are
secondary schools. (Education Week[10], 2019) - Besides, there are 16,5111 combined schools and 691 other types
of schools. (Education Week[11], 2019)
Total Number of Schools in the US
Elementary Schools: 88,665
Elementary Schools
88,665
Total Number of Schools in the US
Secondary Schools: 26,986
Secondary Schools
26,986
Total Number of Schools in the US
Combined Schools: 16,511
Combined Schools
16,511
Total Number of Schools in the US
Other: 691
Other
Source: NCES
Designed by
2. Number of US Schools by Type
In the US, there are three types of schools: traditional public
schools, public charter schools, and private schools. Traditional
public schools are widespread throughout the country and have the
most students. But if you are wondering what to do after high
school, here are some trade
school college statistics[12] to read. Moving on,
these are the latest public school statistics together with private
school numbers.
- According to the 2017–18 survey, there are 98,158 traditional
public schools in America. (NCES[13], 2019) - The US has 34,576 private schools. (CAPE[14], 2020)
- The states with the most private schools are Miami (576), Texas
(513), California (471), Illinois (464), and Pennsylvania (387).
(Private School Review[15], 2020) - Among private schools, 21,548 are affiliated with religious
organizations. (Private School Universe Survey[16], 2018) - There are 7,477 Roman Catholic private schools in the US,
making up 21.7% of religious schools. (Private School Universe Survey[17], 2018) - The National Catholic Educational Association has the most
number of schools (5,331) associated with it. Next is the
Association of Christian Schools International (2,745). (Private School Universe Survey[18], 2018) - The religious association with the least number of affiliated
schools is Solomon Schechter Day School Association (39). (Private School Universe Survey[19], 2018)
Charter Schools
Charter schools in the US are a special case. They are public
schools that can run independently to allow educators to innovate.
Minnesota spearheaded the change, and other states quickly
followed.
- 43 states and the District of Columbia have charter schools.
(National Alliance for Public Charter
Schools[20], 2020) - The national count of charter schools is 7,000. (National Alliance for Public Charter
Schools[21], 2020)

3. Elementary and Secondary Enrollment
Statistics
There were 49.8
million students enrolled in K-12 in 2018[22]. Males exceeded females
in all grade levels, and Caucasians exceeded other ethnicities in
all grades as well.
- Kindergarteners and preschoolers made up 1.36% and 1.62% of the
total school enrollment, respectively. (Statistical Atlas[23], 2018) - 32.8 million students enrolled in grades 1-8 in 2018. (Statistical Atlas[24], 2018)
- 17 million students enrolled in high school in 2018. (Statistical Atlas[25], 2018)
- 2.82 million students matriculated in private elementary
schools in 2018. (US
Census Bureau[26], 2018) - In the same year, there were 29.67 million pupils enrolled in
public elementary institutions. (US
Census Bureau[27], 2018) - 15.52 million students went to public high schools in 2018.
(US
Census Bureau[28], 2018) - And at the same period, 1.19 million attended private high
schools. (US
Census Bureau[29], 2018)
Source: US Census Bureau 2018
4. Number of School Districts in the US
There are 13,568
school districts in the US[30]. There are different
kinds of districts. It depends on the school levels in an area, the
cost, or the formation of the district itself. Here are some facts
that can give you insights into school districts.
- Texas has the most school districts with 1,035. (Ballotpedia[31], 2020)
- Hawaii has the least number of school districts with just 1.
(Ballotpedia[32], 2020) - California has the most enrollees in America with 6 million.
(Ballotpedia[33], 2020) - Washington, D.C. has the fewest students with 76,000 enrollees
only. (Ballotpedia[34], 2020) - In California, the Los Angeles Unified School District is the
largest with 1,012 schools. (Niche[35], 2020) - According to online reviews, Glenbrook High Schools District
225 in Glenview, IL, is the best school district in America. It has
a total of four schools and approximately 5,100 students. (Niche[36], 2020)
Average School Size
How do cities and rural locations measure up to the national
average? A look at the data reveals that suburbs expectedly outsize
other locations in terms of public school enrolment.
- The US national average student size of public schools is
approximately 520 students. (Public
School Review[37], 2020) - Among states, Georgia takes the top spot with 764 average
public school student size. (Public
School Review[38], 2020) - Montana has the lowest average public school student size at
just 177. (Public
School Review[39], 2020)

5. Schools with Online Courses
The Office
of Educational Technology opened in 1994[40] to facilitate the use
of various technological innovations in teaching and learning. The
government agency has spearheaded policy-making in the arena, as
elearning is now widespread in the US.
- 48 states and the District of Columbia support online learning.
(Office
of Educational Technology[41], 2020) - There are seven full-time online schools. States operate three,
districts operate the same number, and a charter operates one. - (Office
of Educational Technology[42], 2020) - Experts predicted that 50% of classes in K-12 would be blended
by 2019. (USA
Today[43], 2019) - Village Green Virtual Charter High School introduced the
blended learning model in the early 2000s and experienced a radical
change. After implementation, it has a 97% graduation rate and a
100% college acceptance rate. (eSchool News[44], 2017) - Study.com ranks Huntley High School ranked number 1 among the
schools using blended learning. (Study.com[45], 2019)
Source: Study.com
6. Special Education Schools in the US
Other than regular elementary and secondary schools, there are
also schools for children with special needs. One of the driving
forces behind special education is the Individuals with
Disabilities Education Act (IDEA). This is a federal law that
enables organizations to offer educational services to children
with disabilities.
General Special Education Statistics
- There are 13 categories of disabilities. Children with any of
these are eligible for special education. (LD Online[46], 2020) - Individuals with special needs from birth until the age of 21
can receive support from districts and states. (Office
of Special Education Programs[47], 2020) - 7 million disabled individuals received special education under
IDEA during the school year 2017–18. (NCES[48], 2019) - Overall, 13.2% of students in the 2017–18 school year were
special needs individuals. (Education Week[49], 2019) - 34% of students aged three to 21 that IDEA served had a
specific learning disability. (NCES[50], 2019)
Demographics and Inclusivity
- Most individuals IDEA helped from 2017–18 were white, numbering
3,409,308. (NCES[51], 2018) - Pacific Islanders had the least number of individuals assisted
by IDEA in the same period with just 20,807. (NCES[52], 2018) - 95% of students with special needs spent part of their school
day in regular classes in 2016. Meanwhile, 63% went to regular
school 80% of the time. (Department of Education[53], 2018) - Students with special needs were 23 times more likely to
receive one-on-one instruction in regular classes. (National Council on Disability[54], 2018) - Indiana has 3,043 students with a developmental delay.
(Indiana Department of Education[55], 2019) - $9,156 is given per pupil with severe disabilities in Indiana.
(Indiana Department of Education[56], 2019)
Special Needs Education Costs
- In St. Louis, Missouri, the most expensive primary school costs
$35,500 a year. It specializes in teaching children with
disabilities like dyslexia and ADHD. (KSDK.com[57], 2019) - The average cost per student is $7,552 currently and there is
an additional $9,369 for every special needs student. (National Education
Association[58], 2019) - The federal government provides less than 20% of the cost
rather than the 40% pledged by the law. (National Education
Association[59], 2019) - In 2017–18, there were 4,854 due process cases filed in
California. These were disputes for children’s special education
placement. (The
San Diego Union-Tribune[60], 2019)

7. Costs of Going to Elementary and Secondary
Schools in the US
Public K-12 schools are mostly free. The only fees parents have
to pay are extracurricular ones. But even those can be optional.
Meanwhile, private schools have high fees, which can include trips
in and out of the country. There are also boarding schools. These
are private schools where students room and board for most of the
school year.
Public Schools
- Full-day kindergarten, in some states, cost $1,000 to $5,000 a
year. This is because states usually fund traditional half-day
programs only. (Vocational Training[61], 2019) - Public elementary schools are completely free. But there are
extra fees that cost anywhere from $10 to $3,500. (Vocational Training[62], 2019) - Extracurricular activities in public schools drive up annual
costs. One school district in Huber Heights, Ohio, has a student
athletics fee of $750 per annum. (Public
School Review[63], 2019)
Private Schools
- Private elementary schools have tuitions ranging from $2,000 to
$50,000 per year. (Vocational Training[64], 2019) - The average private elementary school tuition is $9,946
annually. (Private School Review[65], 2020) - For private high schools, the average tuition is $14,711 per
year. (Private School Review[66], 2020) - Connecticut has the highest average tuition for private
schooling at $24,481 annually. (Private School Review[67], 2020) - Nebraska has the least expensive private school tuition average
at $3,564 per year. (Private School Review[68], 2020) - Boarding schools cost $35,000 to $60,000 per year. (Army &
Navy Academy[69], 2020) - The average tuition of a boarding school for a US citizen is
$56,875 annually. (Boarding School Review[70], 2020)
Source: Vocational Training, Private
School Review, Boarding School Review
Adapting New Education Technology is a
Boon
Devices like computers and tablets have become commonplace, and
the Internet has become accessible. Consequently, education has
evolved in the past decade. As a result, numerous schools in
America augment teaching and learning with these new technologies.
For instance, as shown in the school statistics above, Huntley High
School uses blended learning to good effect. The same goes for
Village Green Virtual Charter High School. Hence, it made a radical
transformation in terms of graduation and college acceptance
rates.
Therefore, new education technology is a boon. But that is not
to say that implementation will be without challenges. However,
with the help of the best learning management software[71], it can be as
smooth-sailing as possible. Although these are meant to optimize
students’ learning, they are also intended to make teachers’ jobs
easier. Regarding this, educators can have an easier time tracking
the progress of students.
Moreover, there are productivity tools that students, teachers,
and administrators can utilize. Take, for example, task
management software[72]. These are all-around
applications that users can employ for school and work. By using
these, they can keep track of the things they need to do.
Additionally, these apps can alert them when a deadline is
upcoming.
These numbers say several things about educational statistics
and enrollment levels in the US. However, other warning signs are
on the horizon. For example, policymakers need to find out why
young adults today have reasons not to go to college
statistics[73].

Read more https://financesonline.com/school-statistics/